
· 4 min read

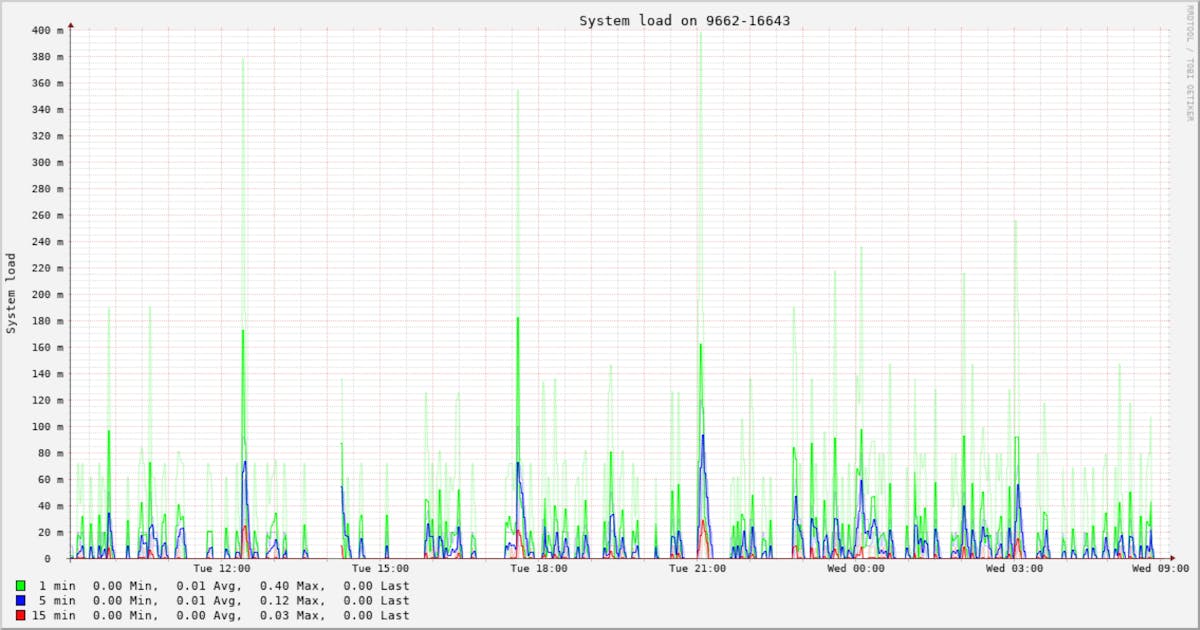
Monitoring the health and performance of your server is critical for preventing unnecessary crashes and problems, it is important to have a system in place that can collect data accurately and display it in an understandable manner.
In order for everyone to access this information without the need for a third-party monitoring software, we have incorporated a feature in the client panel under the performance tab. Here you can access all the important data retrieved by an open source project software – Collectd.
Collectd is a system statistics collection tool that collects system and performance metrics periodically and stores them using RRD files sent to our central server.
It is a low-level system written in C that uses hardly any resources and as all the files are sent to our central server via UDP, it doesn’t affect your server’s storage capacity or performance in any way.
It does, however, provide valuable data on your system’s performance that can help prevent all sorts of issues before they arise.
We install Collectd as a standard on all servers delivered. You can access the graphs in your client panel under the performance tab. Each plugin provides information about the performance of different system components.
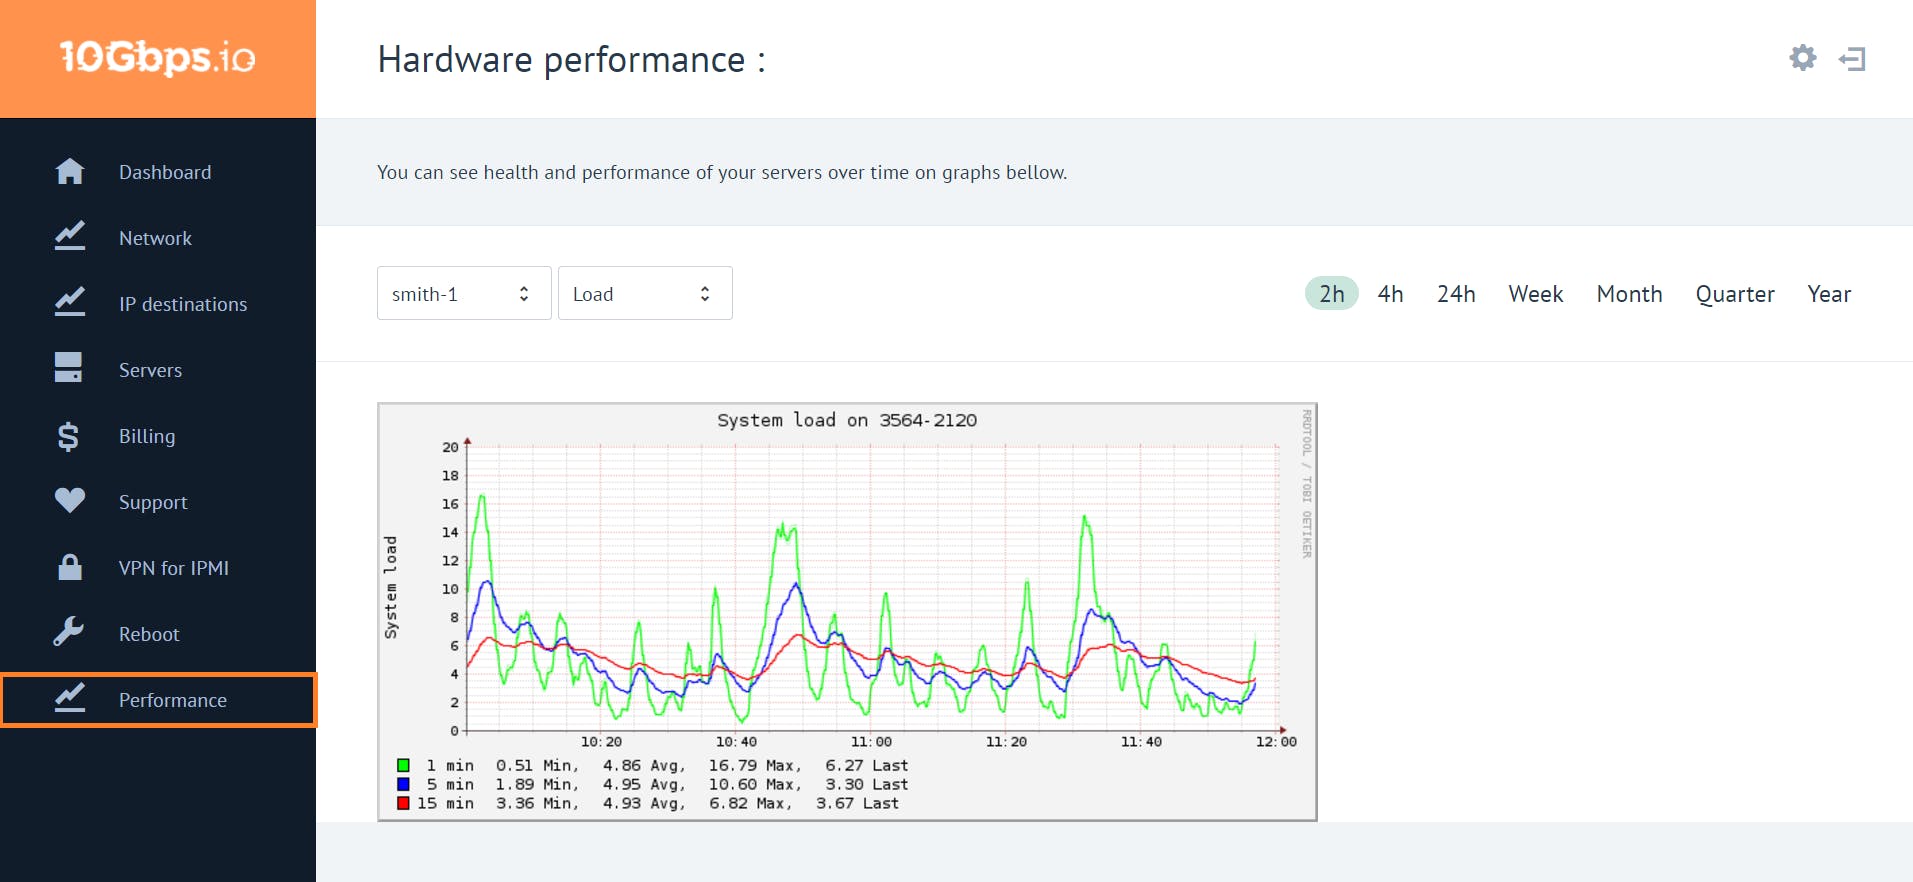
There are 13 accessible plugins in total, in this post, we will only go through the most important sections that should be monitored regularly and that can greatly affect the proper functioning of your system.
The heart and brains of your server. The graphs in this plugin show the different types of tasks your CPU is occupied with. You can see multiple graphs beneath each other, each graph representing 1 core of your processor. It is always best (if your application allows it) to evenly distribute the load to each of your cores.
Neither of your cores should ever reach close to 100% utilization. If that is the case your CPU is not powerful enough to sustain the load of your application.
The picture below shows sample graph shots of a server with 24 cores. As you can see, the utilization is up to 40% with user processes. By core 9-12 we can see a significant decrease in utilization and from core 18-24 there is hardly any utilization at all.
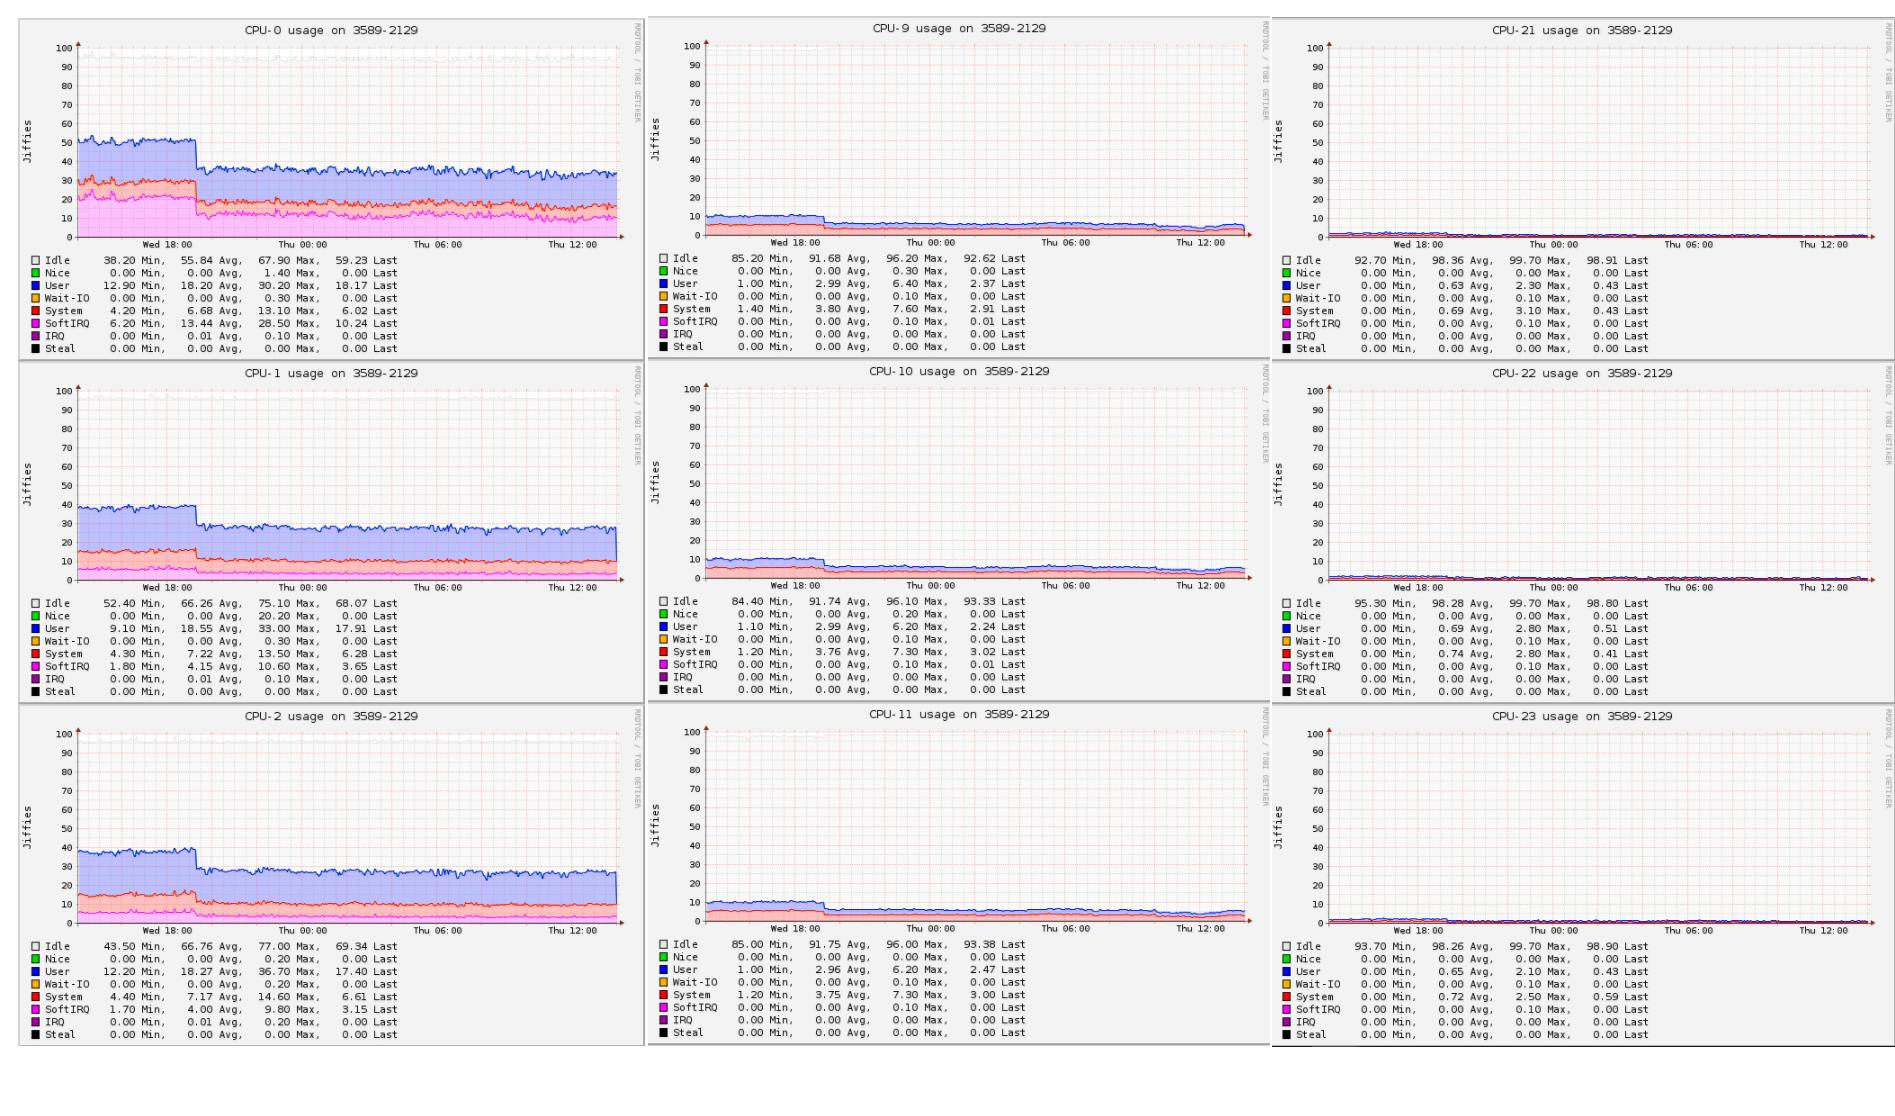
If you’re seeing similar graph images in your client panel, what is necessary to do at this point is try configuring your application to distribute the load evenly between all of the available cores.
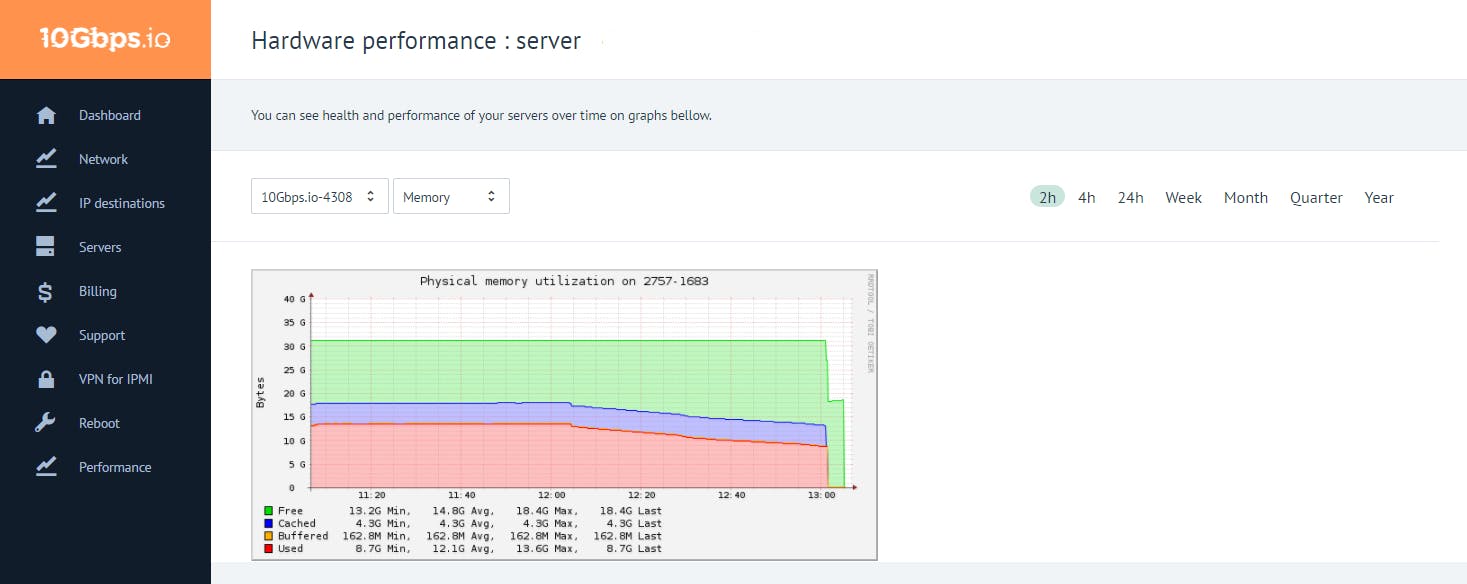
The memory tab displays physical memory utilization.
The green color represents the total memory available in your system (the memory you paid for) this memory is using up power and isn’t necessarily doing anything useful.
The blue color represents the amount of memory used for caching files it has accessed. Cached memory can always be up to 100% as the system will free it if it is required by other system processes.
The red color represents the amount of memory being currently used in real-time. The maximum amount used should be below 90%.
If the utilization reaches close to a 100% the Linux kernel will revoke an OOM killer and start sacrificing processes in order to free up memory for the system.
If you see in your client panel that your used memory is reaching 85% you should try optimizing your application for better memory management, however upgrading your memory should also be your top priority.
Represents the utilization of mounted partitions. In other words, how much space is used on a mounted partition and how much is available.
For obvious reasons there is nothing that can jeopardize the functioning of your system in this report, it can only tell you when the right time to upgrade your storage has come.
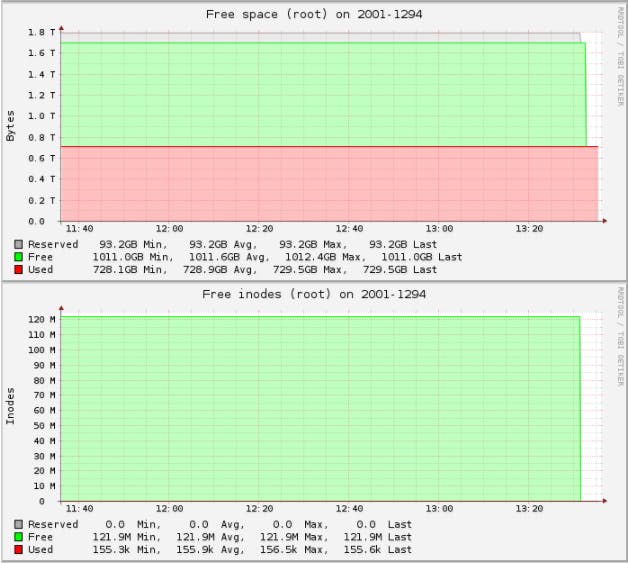
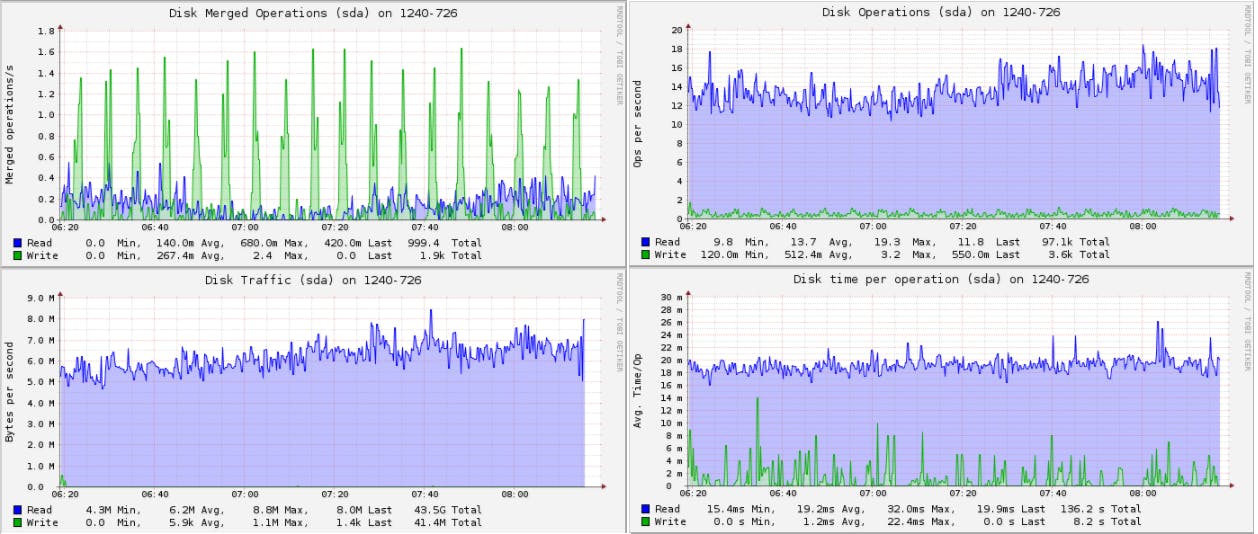
The disk tab collects the performance statistics of hard-disks. Specifically, information on how many read and write operations are performed and how long it takes to execute them.
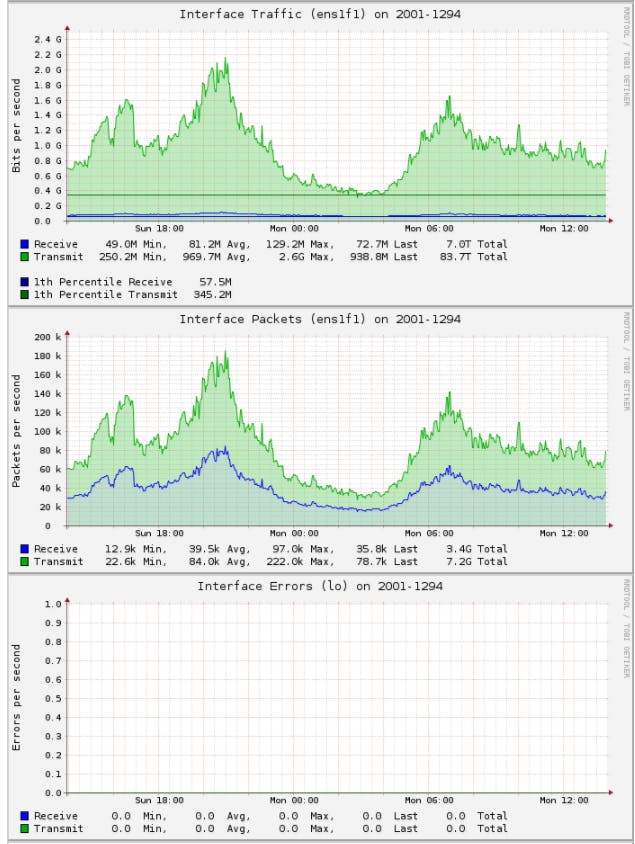
The interface plugin collects information about the traffic (octets per second), the number of packets per second and errors for each interface. Here it is important to check if your port is close to beeing saturated, then it is either necessary to add another machine to your infrastructure or add another port to your existing server.
As mentioned before, apart from the plugins described in the post, you can access additional data about your system’s performance via additional plugins. For a description on how the data for each plugin is collected and what it represents, you can visit the official Collectd Wiki.
And of course, if you have any questions regarding the tool or have a request regarding application configuration or a hardware upgrade, raise a ticket with our technicians and they will gladly be of assistance.
Founded in 2014, DataPacket is a dedicated server provider operating a global low-latency network. With a footprint of 67 locations across 6 continents, DataPacket helps businesses–including gaming and video streaming companies–to deliver great online experiences.